
Case Study · Real Estate Investment
Arden Capital
A portfolio intelligence platform for a real estate fund manager, on desktop and mobile.
Arden Capital manages a globally diversified real estate portfolio from the US. Its performance data lived in spreadsheets, a legacy BI dashboard and PDF investor reports. We designed and built one platform that takes an investment team from the whole portfolio down to a single asset — and on to a decision.

Client / Product Overview
A real estate investment manager — “Disciplined investments. Enduring value.” — holding logistics, multifamily and office assets. Its team tracks performance across the portfolio continuously and reports on it to investors.
- Industry
- Real Estate Investment
- Services Provided
- Web & Hybrid App Development
- UI/UX Design
- Mobile App Development
- Project Scope
- Audit of the legacy dashboard and reporting workflow, decision-journey strategy, UX and UI design, and the web application — portfolio command centre, performance ranking, single-asset intelligence, comparison, and a global map with investment signals — plus a companion mobile app.
Before
The Challenge
The old dashboard showed everything at once: a dozen KPI tiles, dense tables and charts competing for the same screen. Anything it didn't show lived in Excel or a PDF report. Answering a simple question — which assets need attention, and why — meant cross-referencing three sources by hand.
Approach
From the problem to a direction
Strategy first, then the experience, then how it looks.
- 01
Discovery / Strategy
We started from the decisions the team actually makes and worked backwards to the data each one needs. That produced a five-step decision journey — Monitor, Identify, Compare, Investigate, Decide — which became the structure of the platform.
- 02
UX Approach
Each step of the journey is a screen: the command centre monitors, the performance overview identifies what's outperforming or needs attention, comparison puts assets side by side, and property detail supports the deep dive. Scores and status labels do the first pass of triage, so the team reads less to know more.
- 03
UI / Visual Direction
Navy and gold with a serif display face — the confidence of a private fund, applied to data-dense screens. Colour is kept for status (Outperforming, Watch, Attention) so it always means something, and the mobile app switches to a dark theme for quick checks on the move.
The Build
Development
A web application and companion mobile app over the same portfolio data: valuations, occupancy, yield, NOI growth, income and expenses, tenant rosters and investment signals. Every property carries a performance score and a status, so the same assessment ranks it in the overview, frames it in detail and sets it against others in comparison.
Key Features
- 01Portfolio command centre: value, occupancy, NOI, yield, appreciation and a portfolio health score
- 02Ranked property performance with trend sparklines and Outperforming / Watch / Attention status
- 03Single-asset intelligence: valuation, NOI and occupancy history, income and expenses, tenant roster
- 04Side-by-side comparison across valuation, occupancy, yield, NOI, appreciation and overall rating
- 05Global portfolio map with investment signals, top risks, opportunities and a watch list
- 06Mobile app for alerts, portfolio overview, property summaries, comparison and performance
The Result
Final Product
One platform in place of the spreadsheet, the dashboard and the PDF. The team opens the command centre, sees what needs attention, and can compare, investigate and decide without leaving it — at a desk or from a phone.
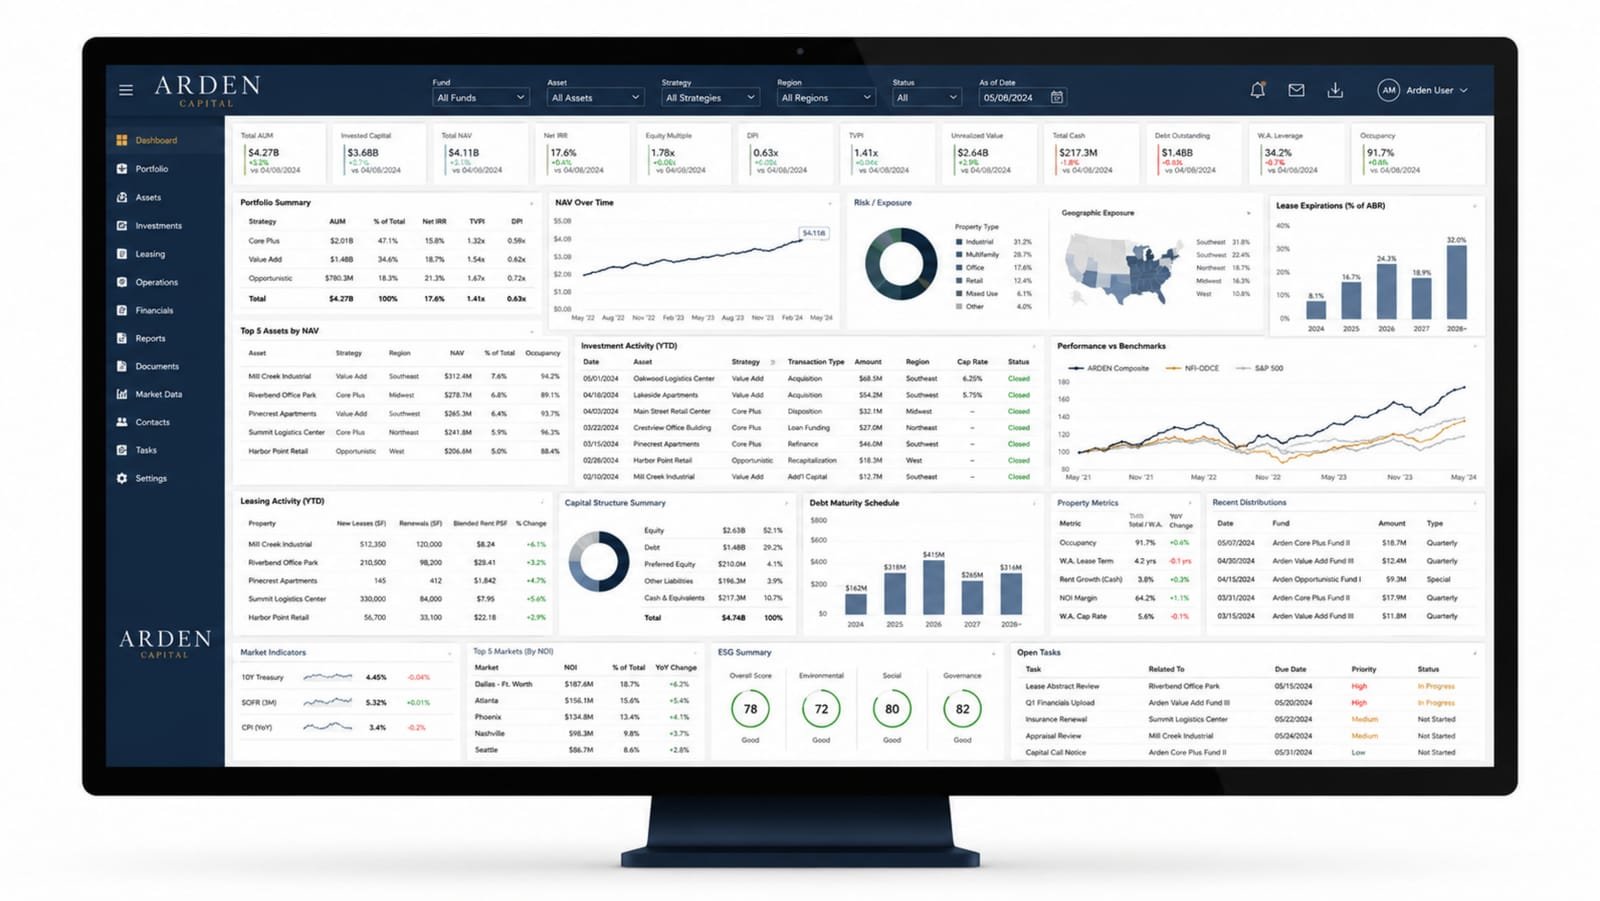
01 / 10Before: the legacy dashboard, with every KPI competing for the same screen 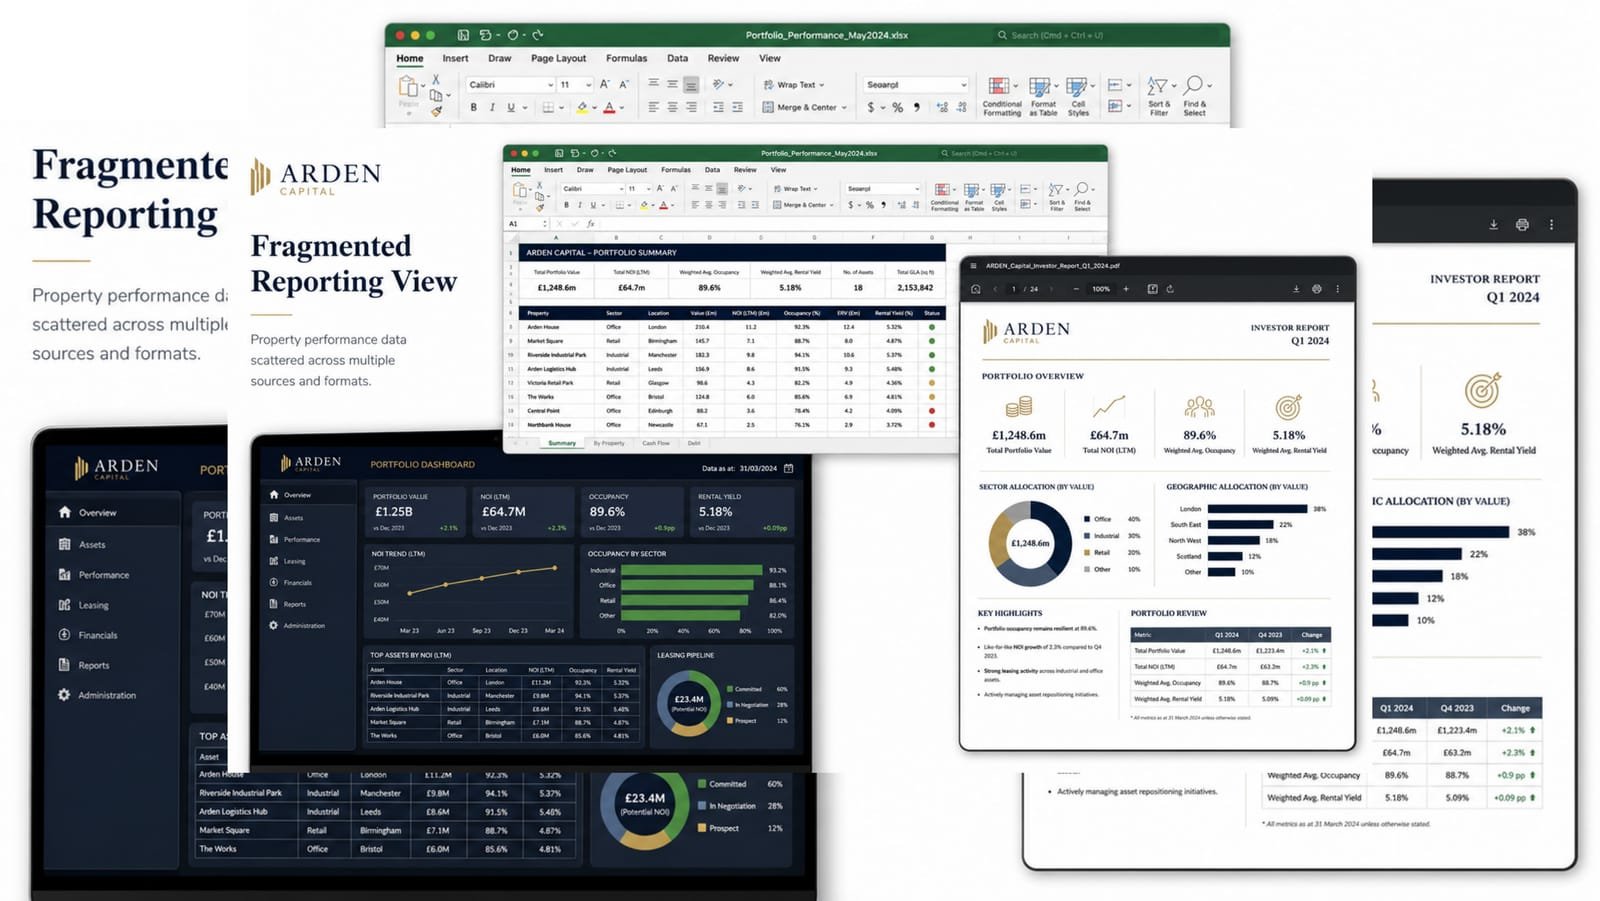
02 / 10Before: performance data split across Excel, a BI dashboard and PDF investor reports 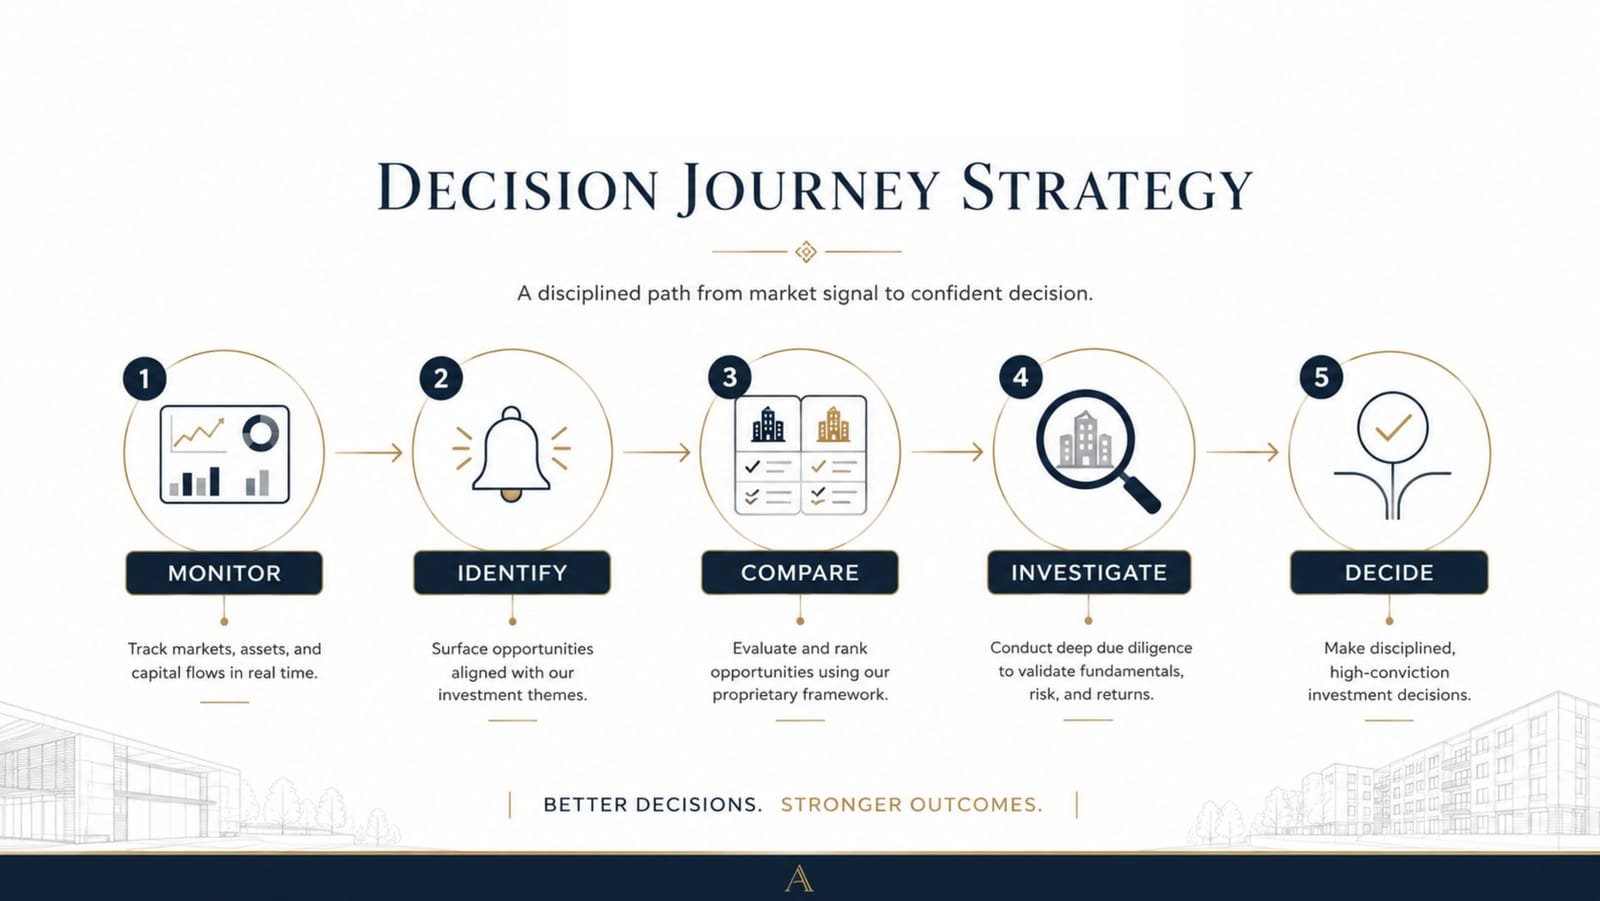
03 / 10Decision journey strategy: Monitor, Identify, Compare, Investigate, Decide 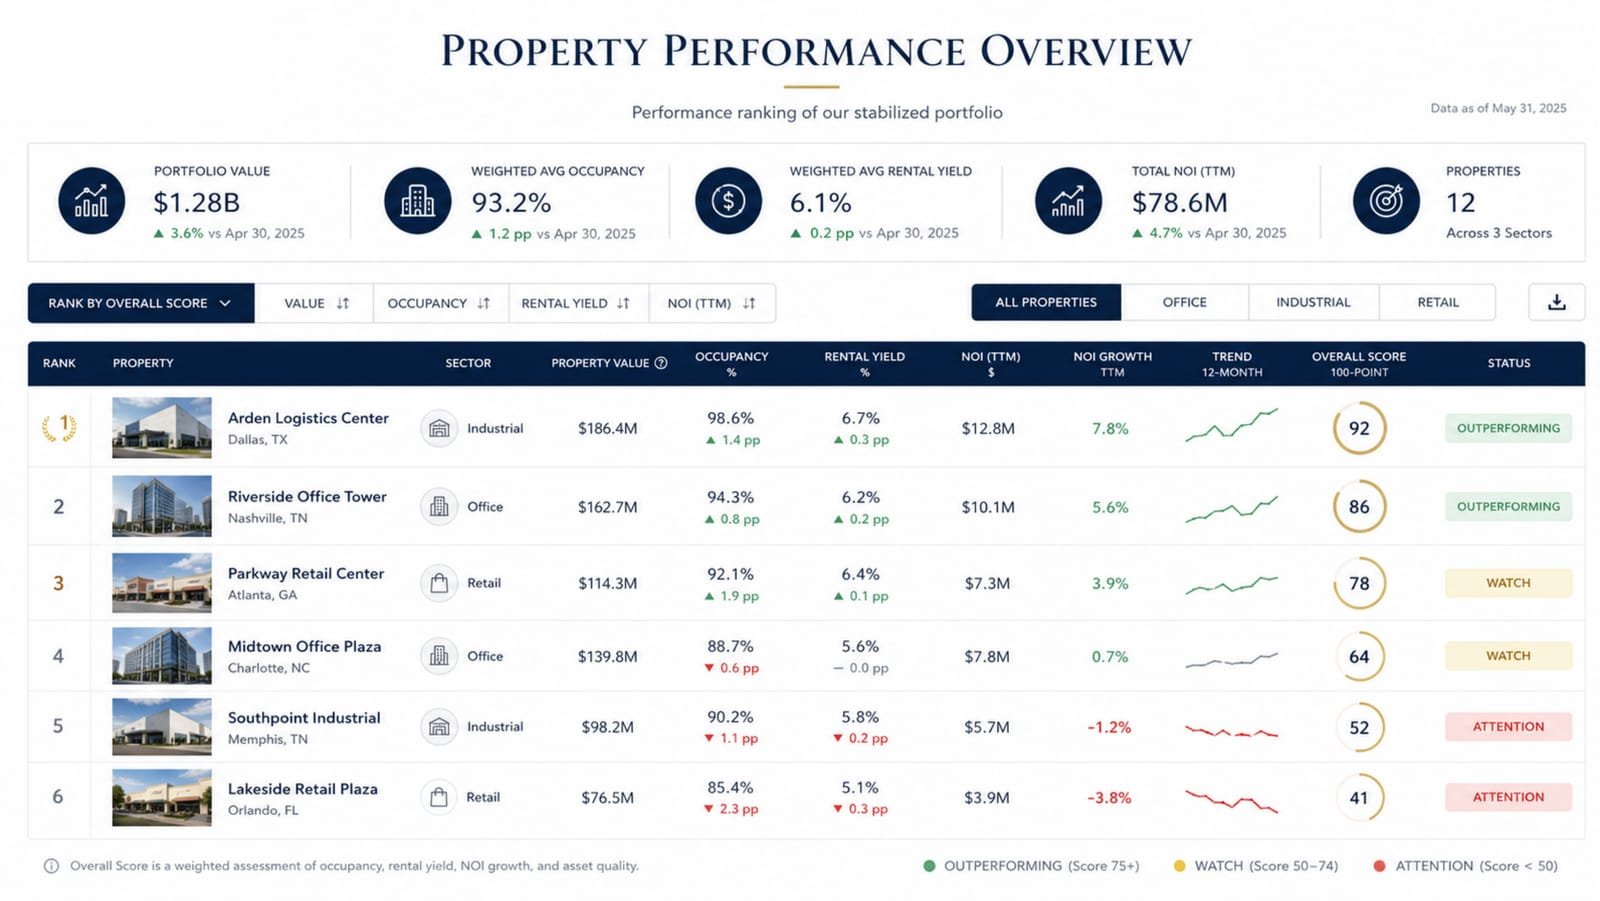
04 / 10Property performance overview, ranked and scored 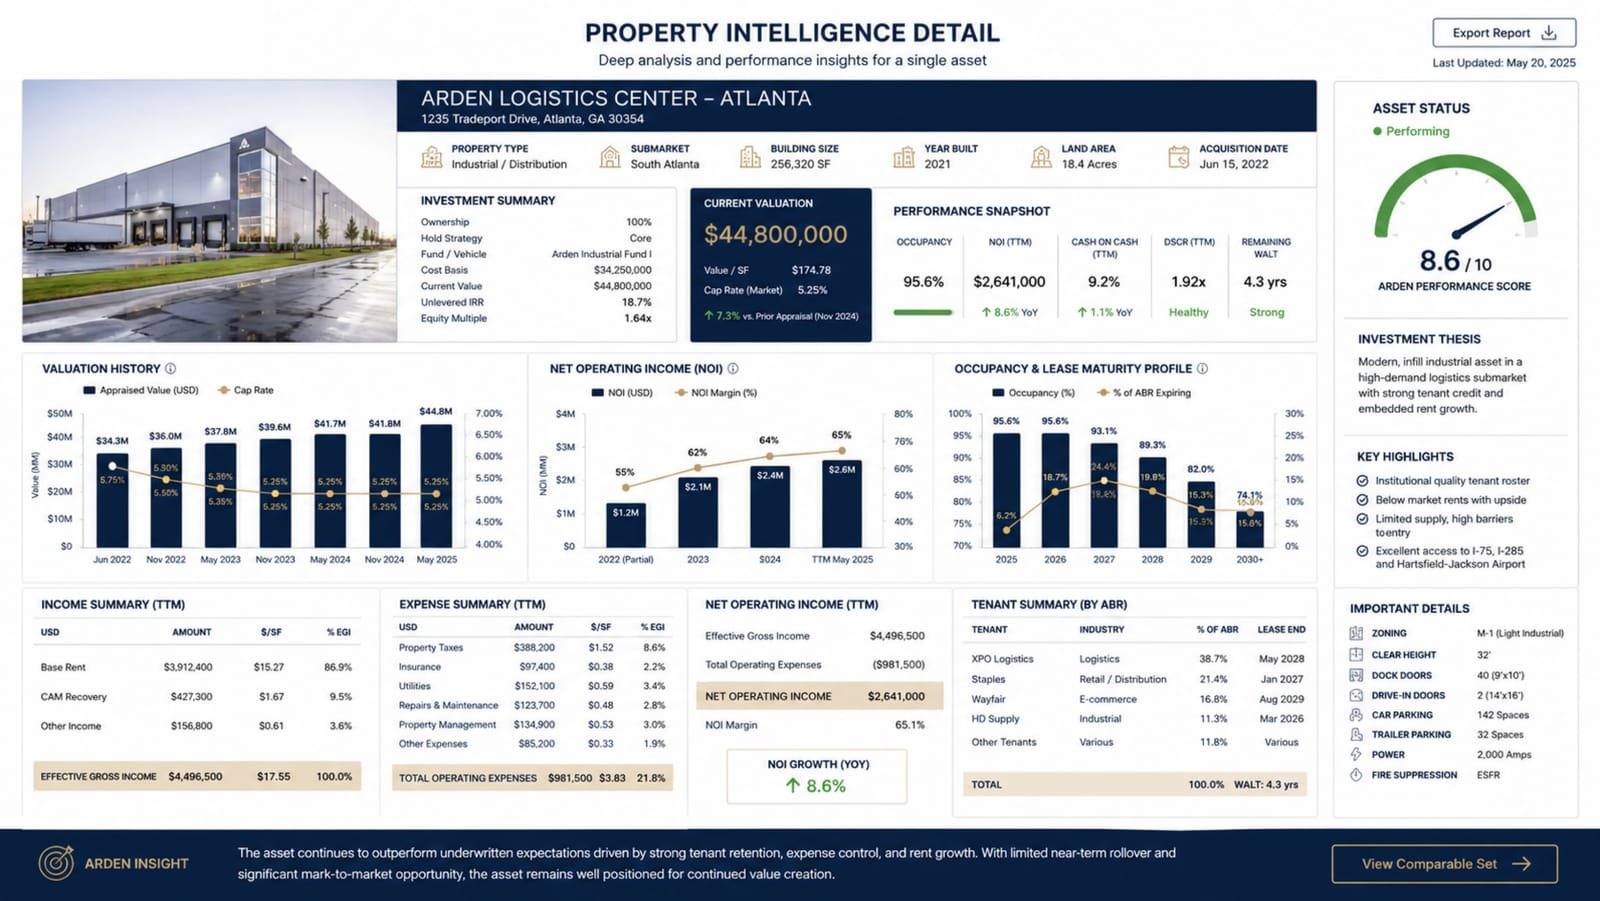
05 / 10Property intelligence detail for a single asset 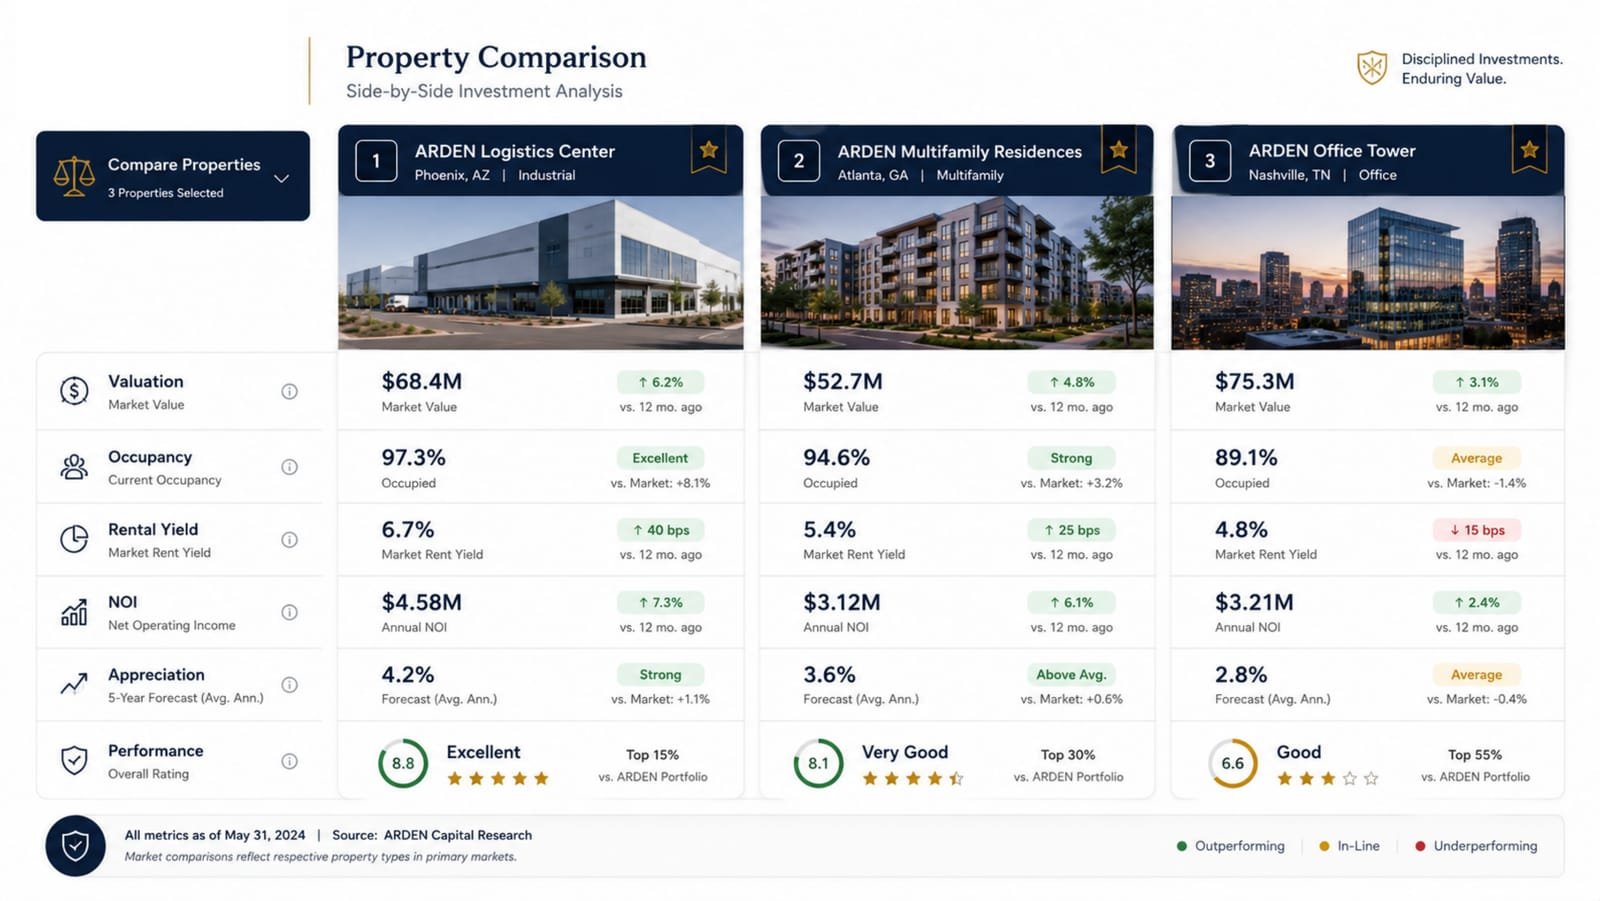
06 / 10Comparing three properties side by side 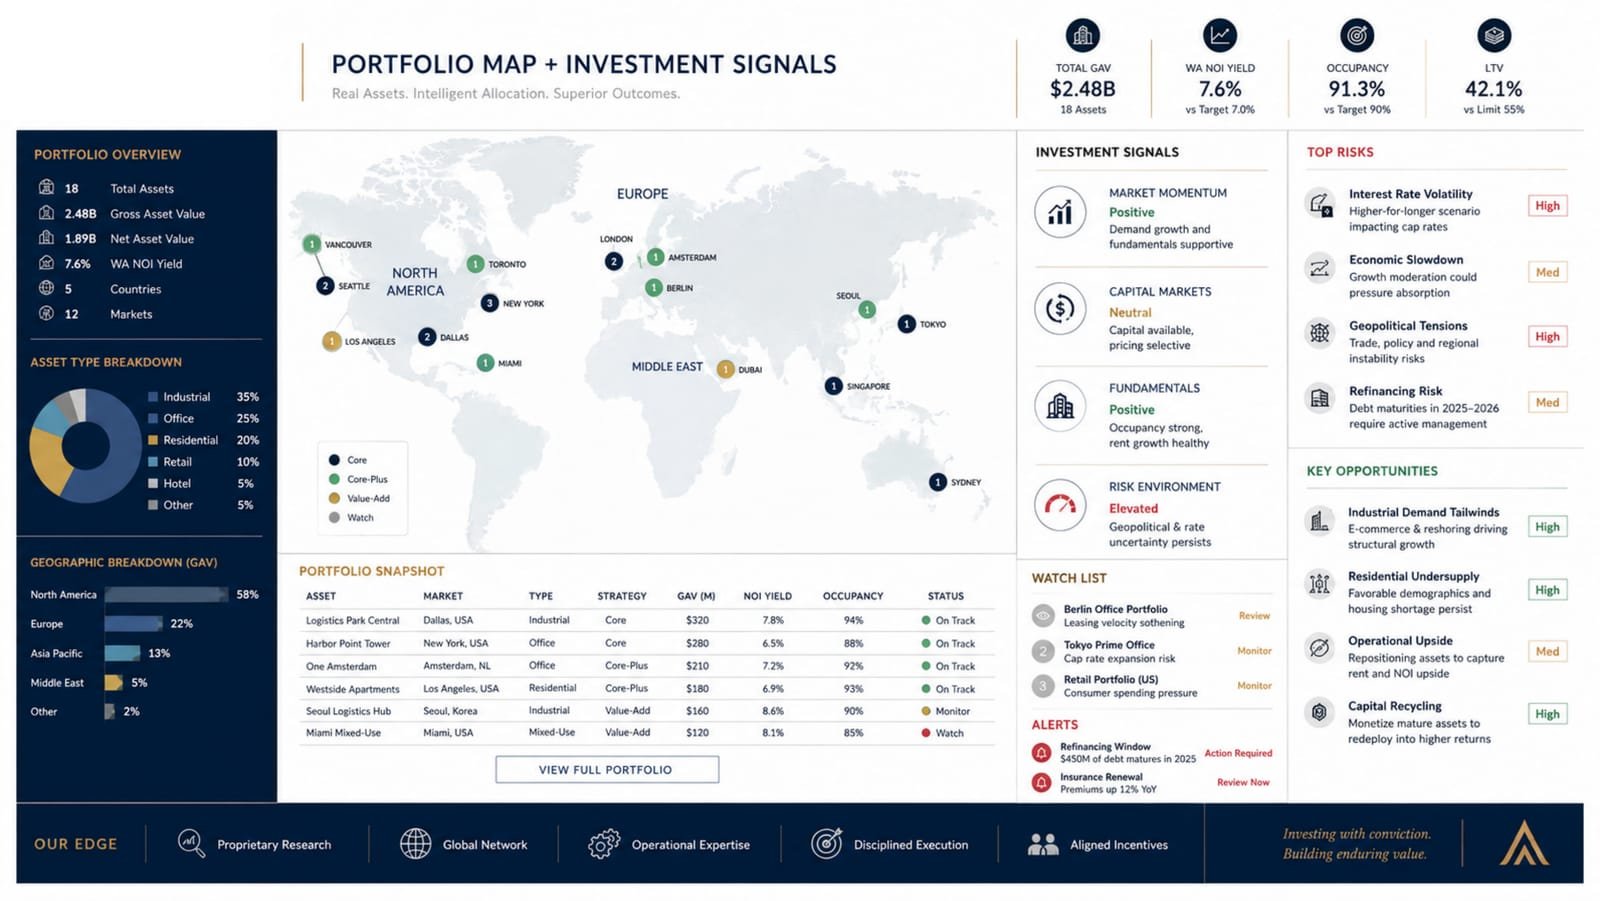
07 / 10Portfolio map with investment signals 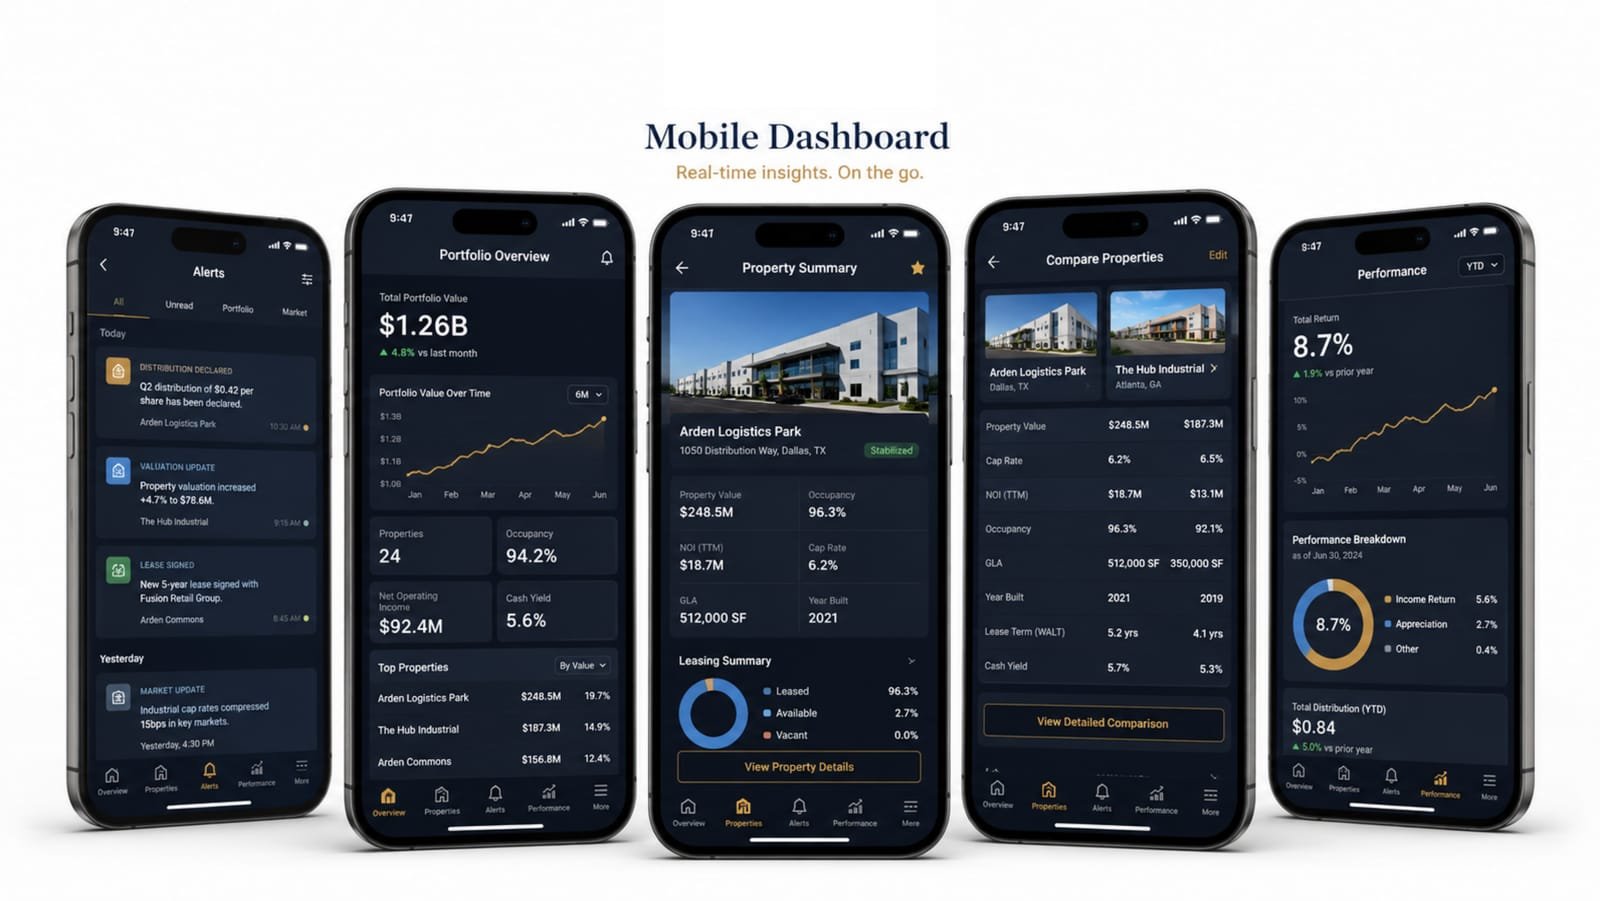
08 / 10The mobile app: alerts, overview, property summary, comparison and performance 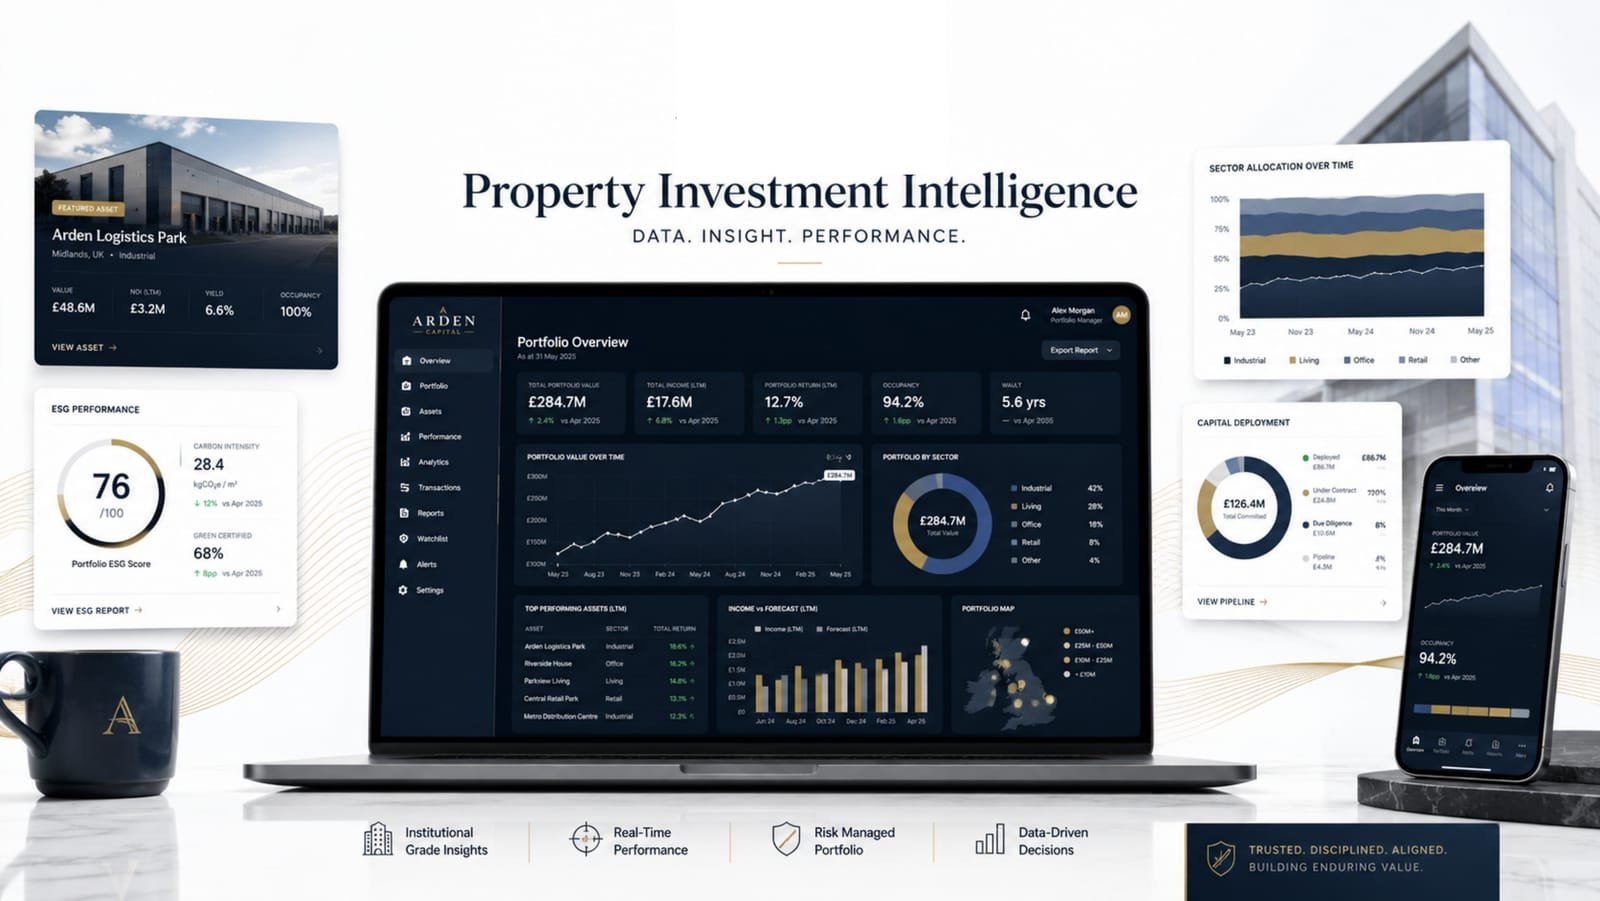
09 / 10Arden Capital across laptop and mobile 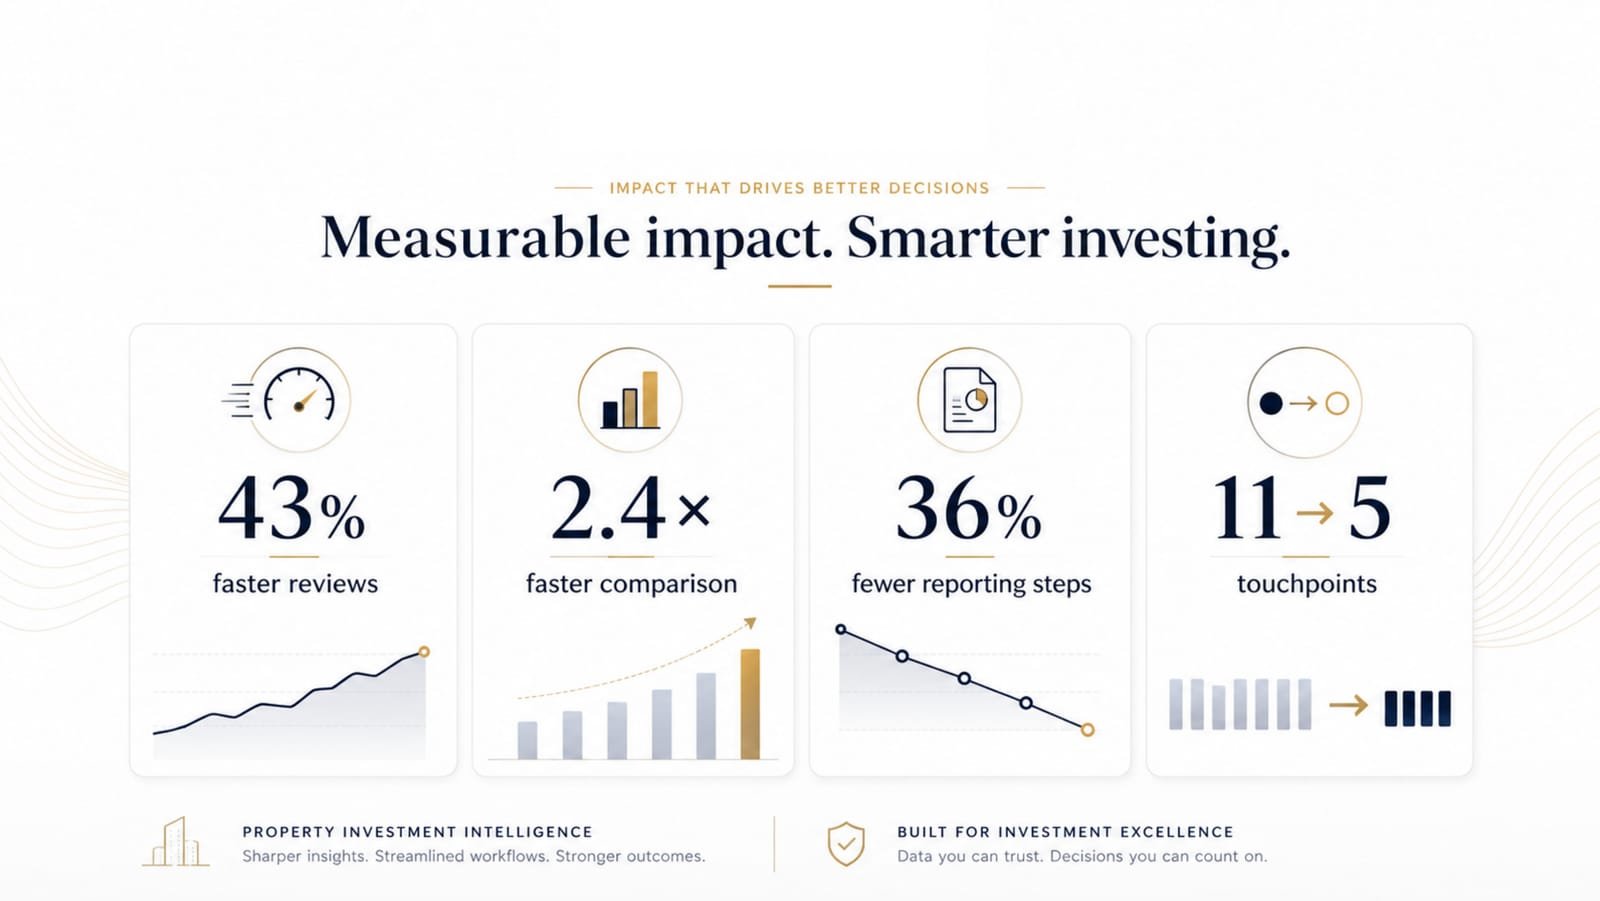
10 / 10Impact and results board


Outcome
Results
Reviews and comparisons got substantially faster, reporting lost more than a third of its steps, and the number of places the team has to look fell from eleven to five.
- 43%Faster reviews
- 2.4×Faster comparison
- 36%Fewer reporting steps
- 11 → 5Touchpoints

Start a Similar Project
Planning something similar?
Tell us what you're building and what it has to do. We'll come back with how we'd approach it — the same way we approached Arden Capital.
Services on this project